
Leave a website provider
Recover authorized control, preserve the and customer path, handle withheld access, and move without turning one provider problem into five new ones.
Read the exit guideResources
Use these guides to understand scope, ownership, continuity, and the machinery behind a website or lead system before committing money or access.
Built by digital engineers. Explained in plain English.
Selected resources
Each collection supports a real buying, ownership, visibility, or continuity decision.
Recover authorized control, preserve the and customer path, handle withheld access, and move without turning one provider problem into five new ones.
Read the exit guideEvaluate scope, ownership, content responsibility, , , and migration risk before signing a proposal.
Read the buyer guideMap ownership, access, , data, , , , and before changing providers.
Read the rescue guideTranslate technical language into the business decision hiding underneath it.
Search the glossaryReview how a useful website, client-owned hosting, maintenance, ownership, and recovery fit together as one understandable system.
Review the website serviceBoho Analytics in practice
Search visibility, website traffic, durable form records, and site structure can be reviewed together without pretending they are the same metric.
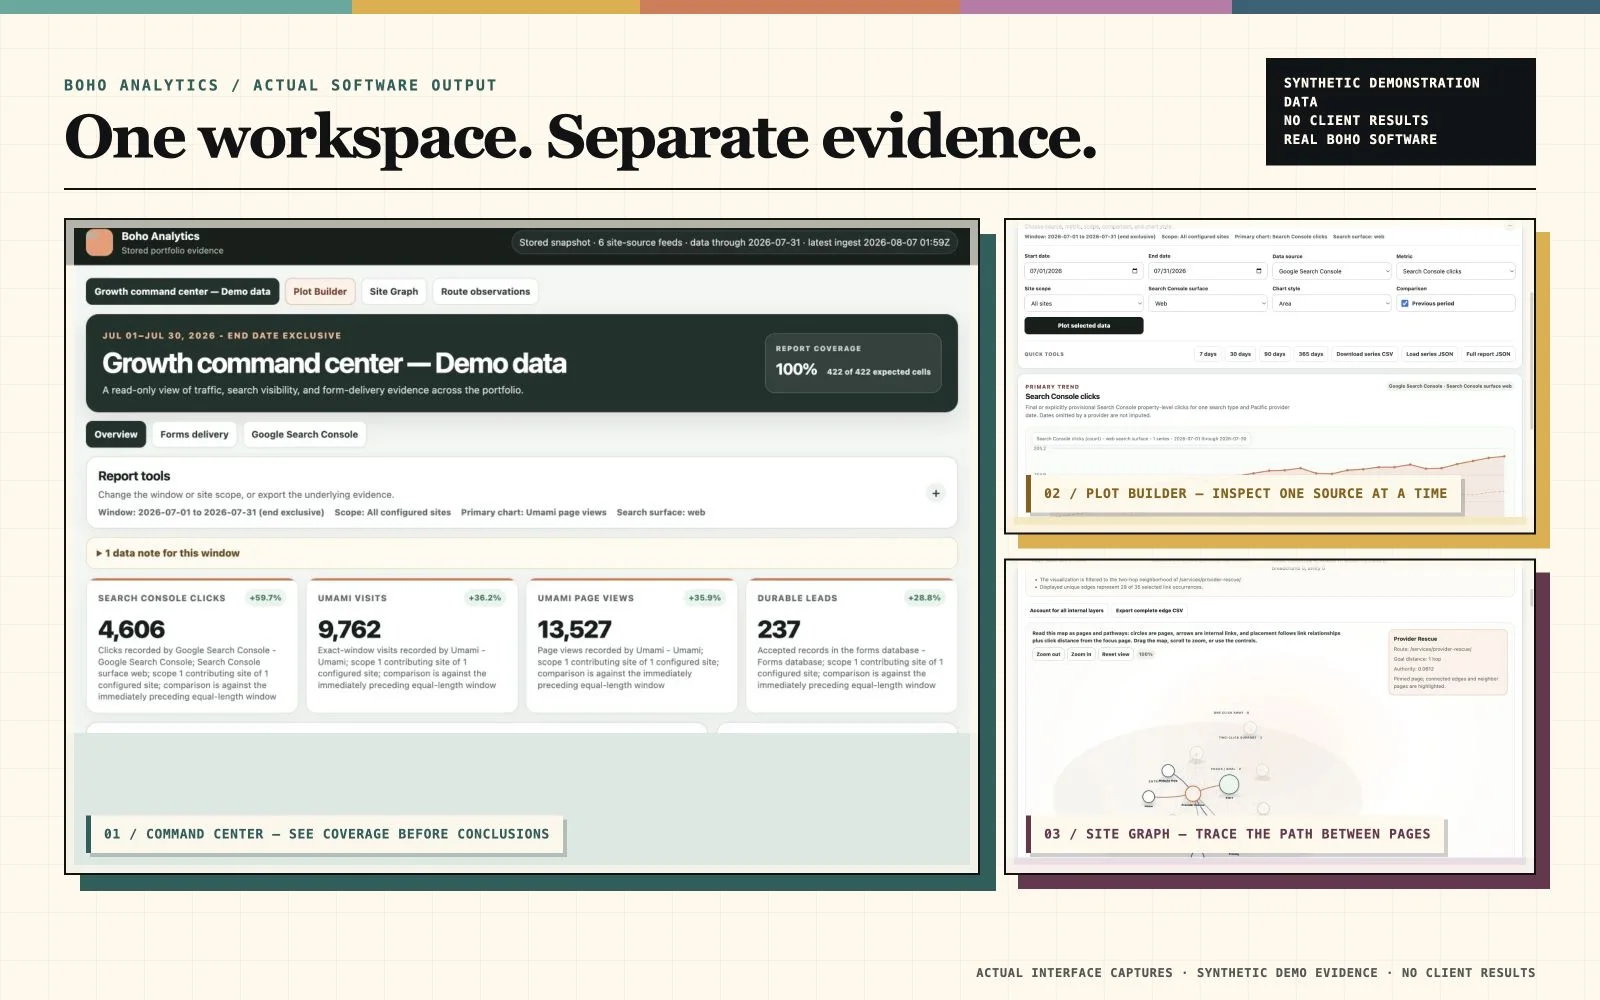
Built by Boho for the SEO work we actually do · Public release v0.2.0
Want to handle the measurement side of organic yourself? Boho Analytics is the in-house command center behind our measurement . Self-host the public , or inspect how Boho keeps search, traffic, infrastructure, forms, and separate before making recommendations.
Free means a $0 software license—not free hosting, provider accounts, SEO labor, support, or custom integrations.
Boho designed the platform to run its own source-labeled SEO measurement—not as a detached side project.
The current MIT-licensed public core helps people trying DIY measurement or not ready for an SEO retainer—and makes our measurement method inspectable before money changes hands.
Use it yourself or hand the source and documentation to a technical person, host, or another provider.
Source-labeled overview
The command center keeps each source’s exact reporting window, previous-period comparison, coverage, freshness, and data health visible. A failed provider sync does not silently erase the other evidence or turn missing data into a zero.
Important: search clicks are not sessions, and edge requests are not visitors.
Inspect the public source (opens in a new tab)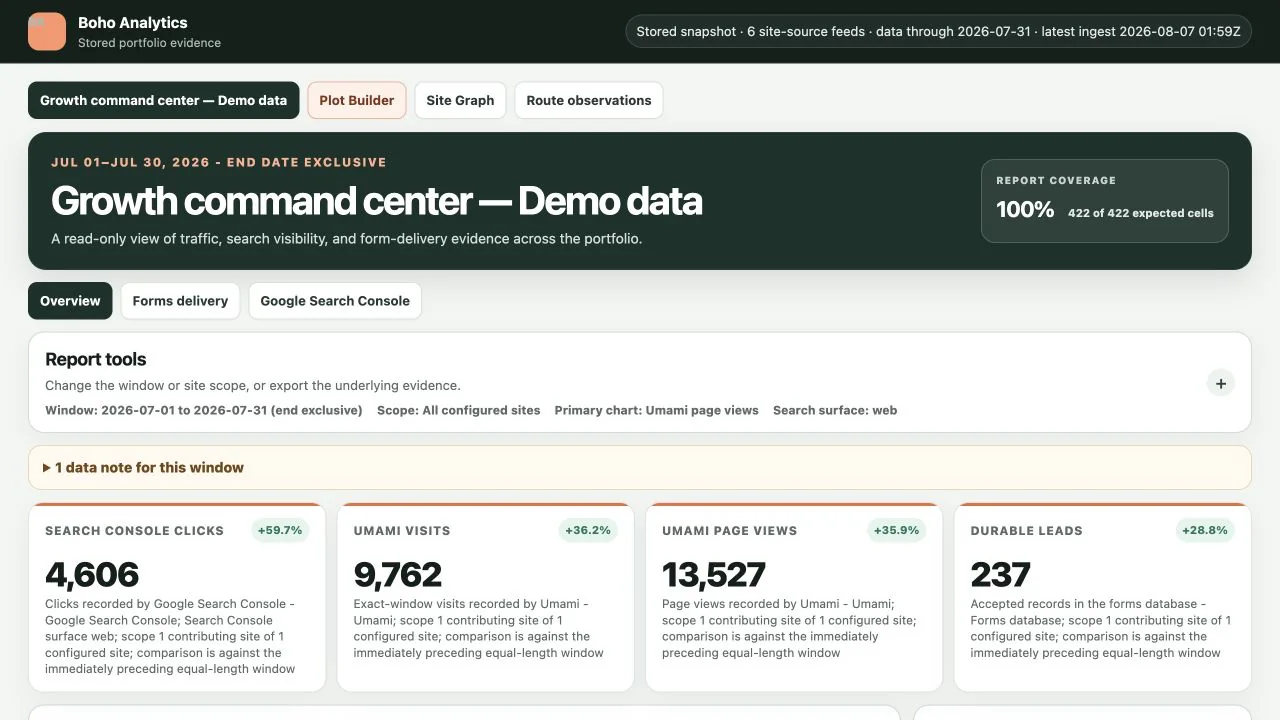
Answer a specific question
Plot Builder lets an operator choose a stored source, metric, website, reporting window, chart form, and previous-period comparison. The same bounded evidence can be exported as JSON or CSV for further review.
Read-only by design: the browser reads normalized local aggregates; it does not contact providers or trigger a sync.
Read the provider setup notes (opens in a new tab)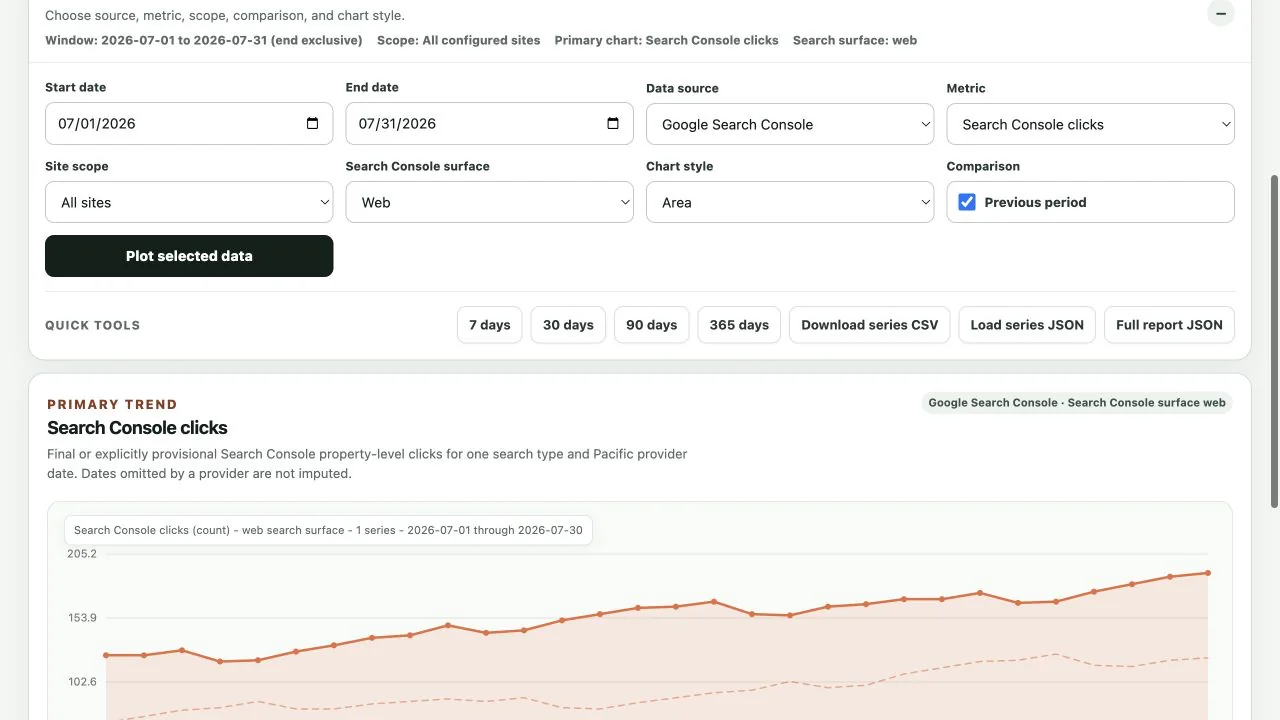
Revision-pinned structural evidence
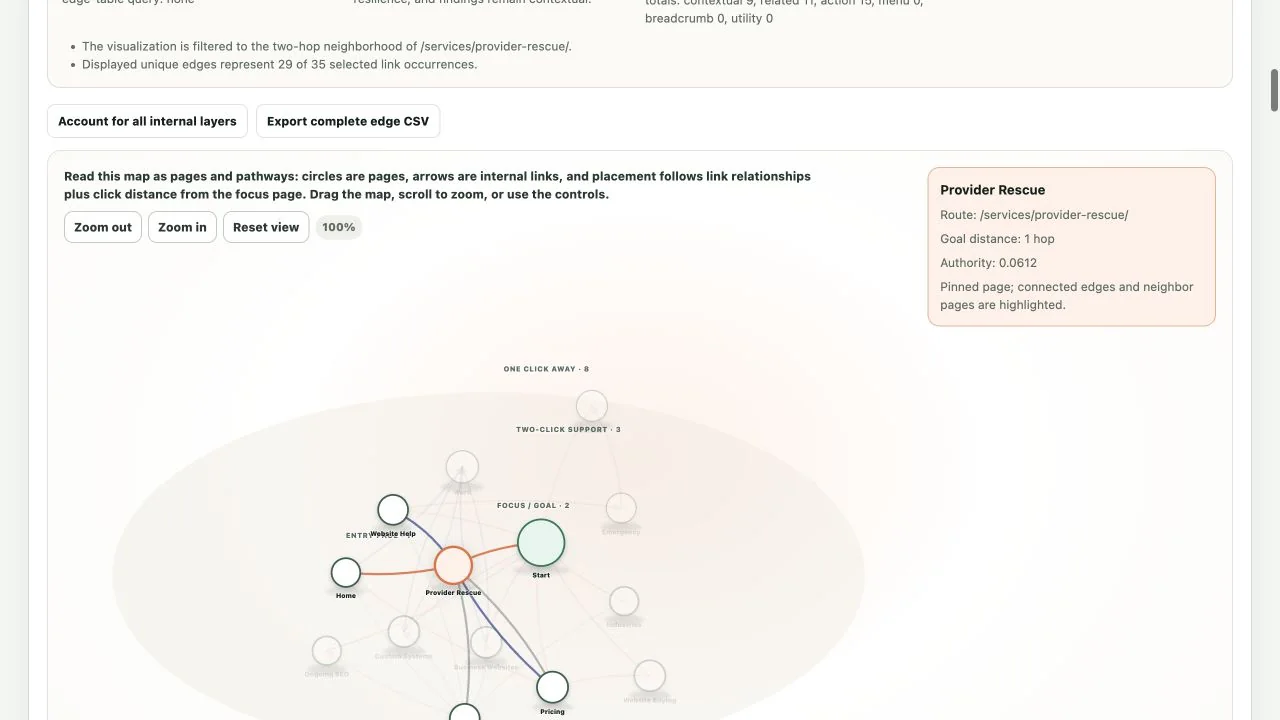
Site Graph maps a specific revision’s pages and internal-link layers: contextual, related, action, menu, breadcrumb, and utility. It can inspect two-hop neighborhoods, goal distance, orphans, dead ends, unresolved targets, and dependence on the shared site shell.
Structural only: Site Graph does not establish visitor behavior, conversions, search authority, or rankings.
Read the engine documentation (opens in a new tab)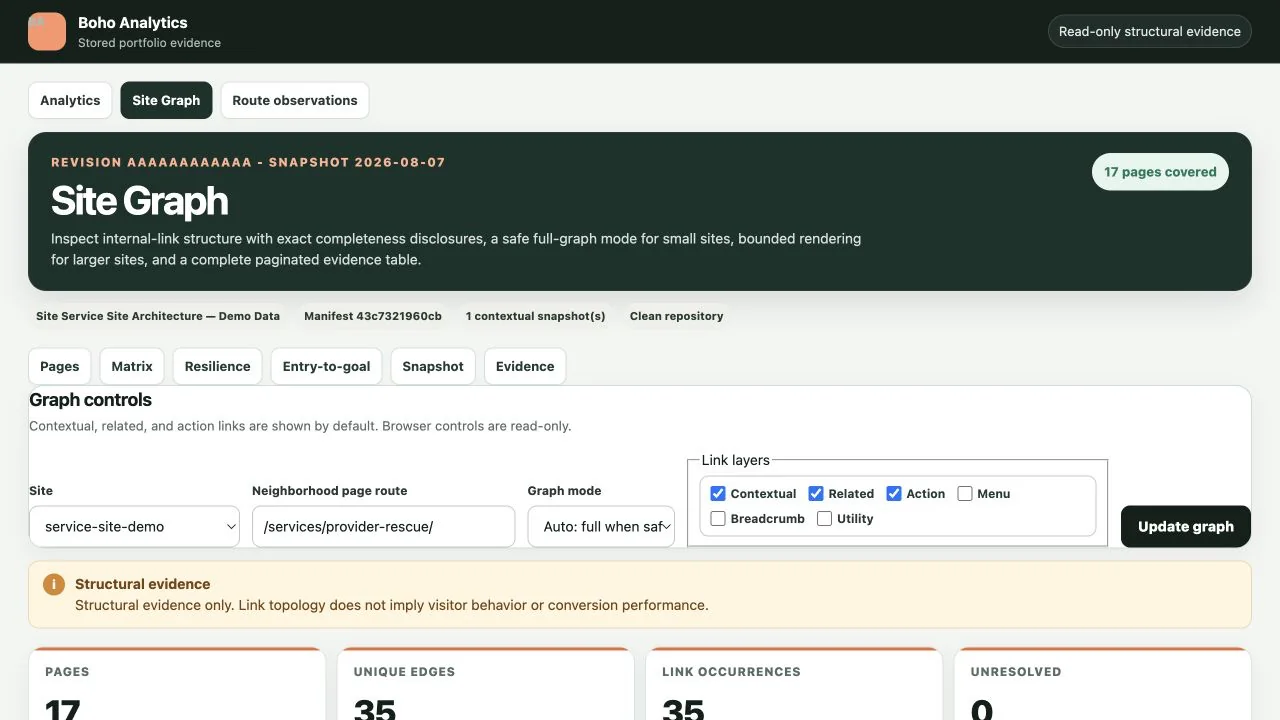
Choose by decision
Most agencies start with a package. Boho starts with the business.
Boho report standard
A substantial report should show where its information came from, what failed or remained uncertain, and which small set of actions deserves attention next.
Identify the review period, websites, properties, markets or systems, sources used, and the last successful collection or review date.
Call out required-source failures, stale information, incomplete access, conflicting platforms, and any limitation that changes what can be concluded.
Keep directly observed facts, calculated or derived values, and analyst interpretations visibly distinct instead of presenting every number as equal evidence.
Lead with three to five priority actions, identify what should not be purchased yet, and define how the next change will be validated.
A practical next step
Send the website, proposal, provider situation, or system that feels unclear. Boho will help identify the useful question and the smallest credible next step.